
 Image 1 of 5
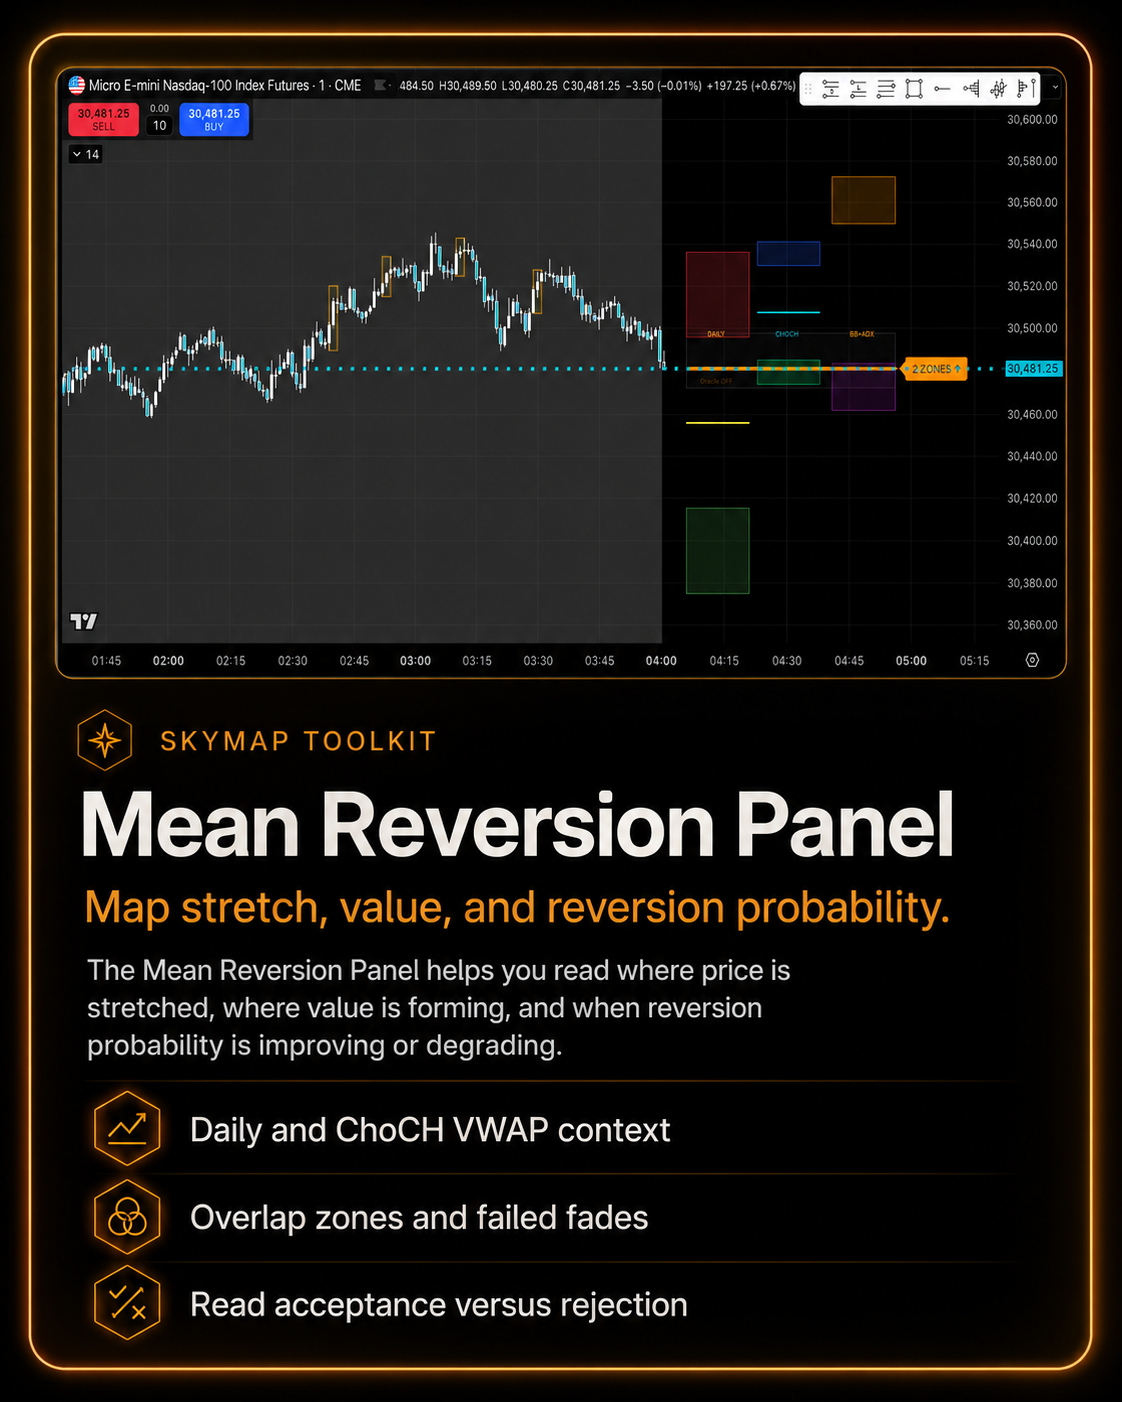 Image 2 of 5
 Image 3 of 5
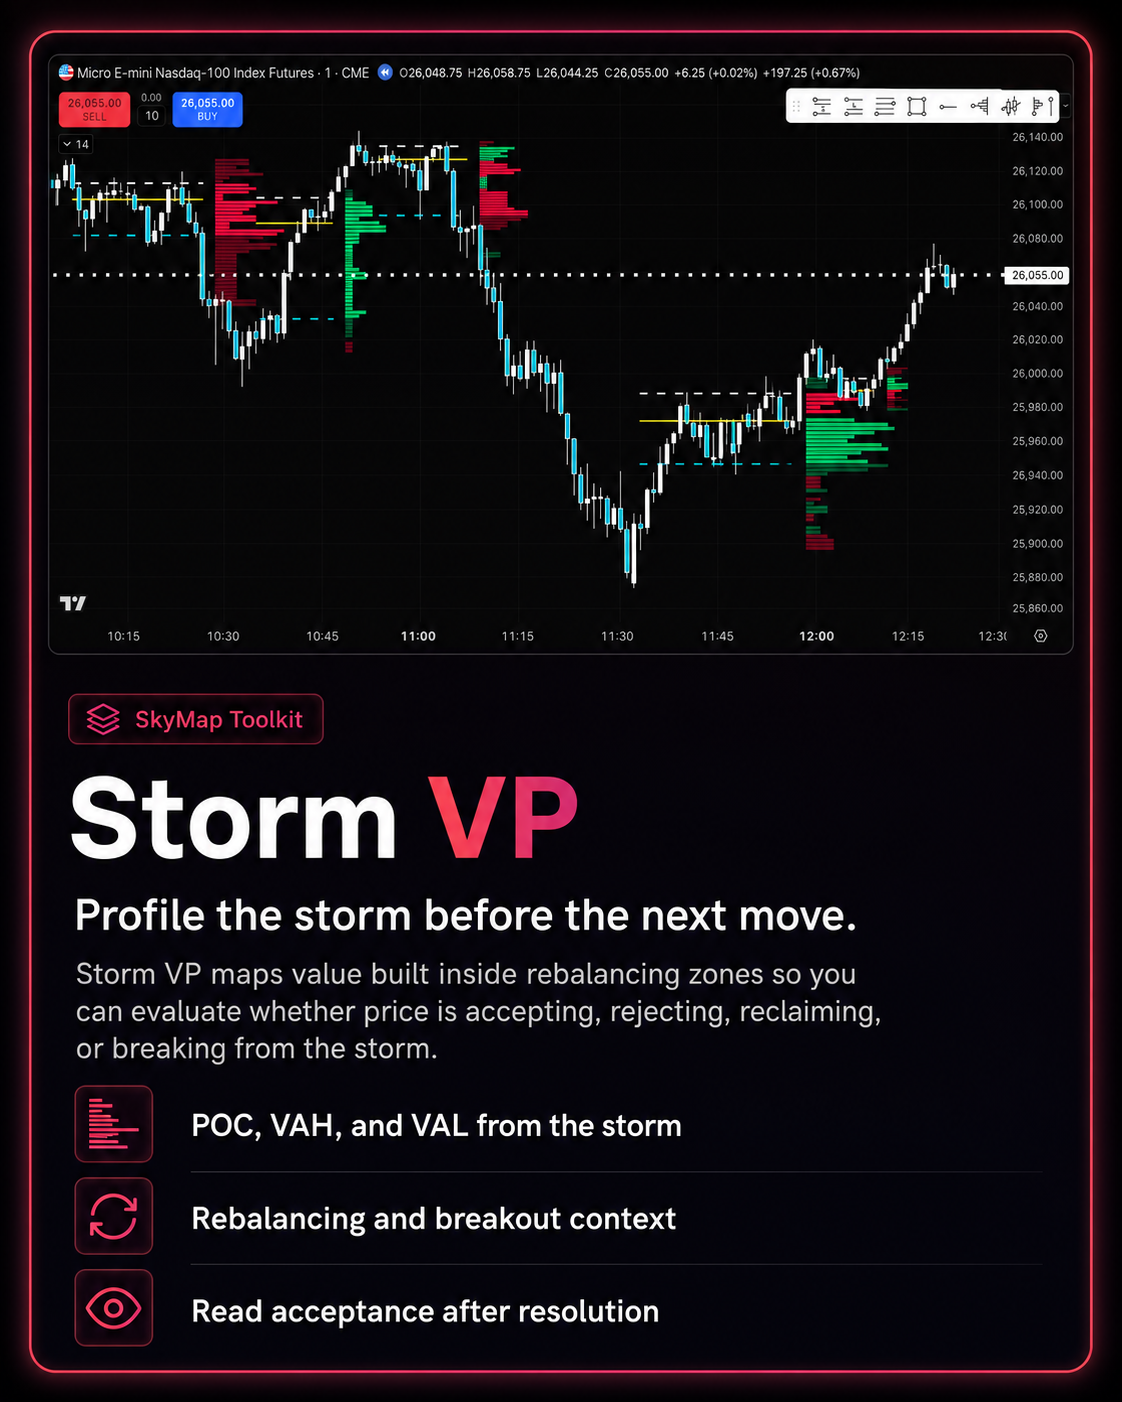 Image 4 of 5
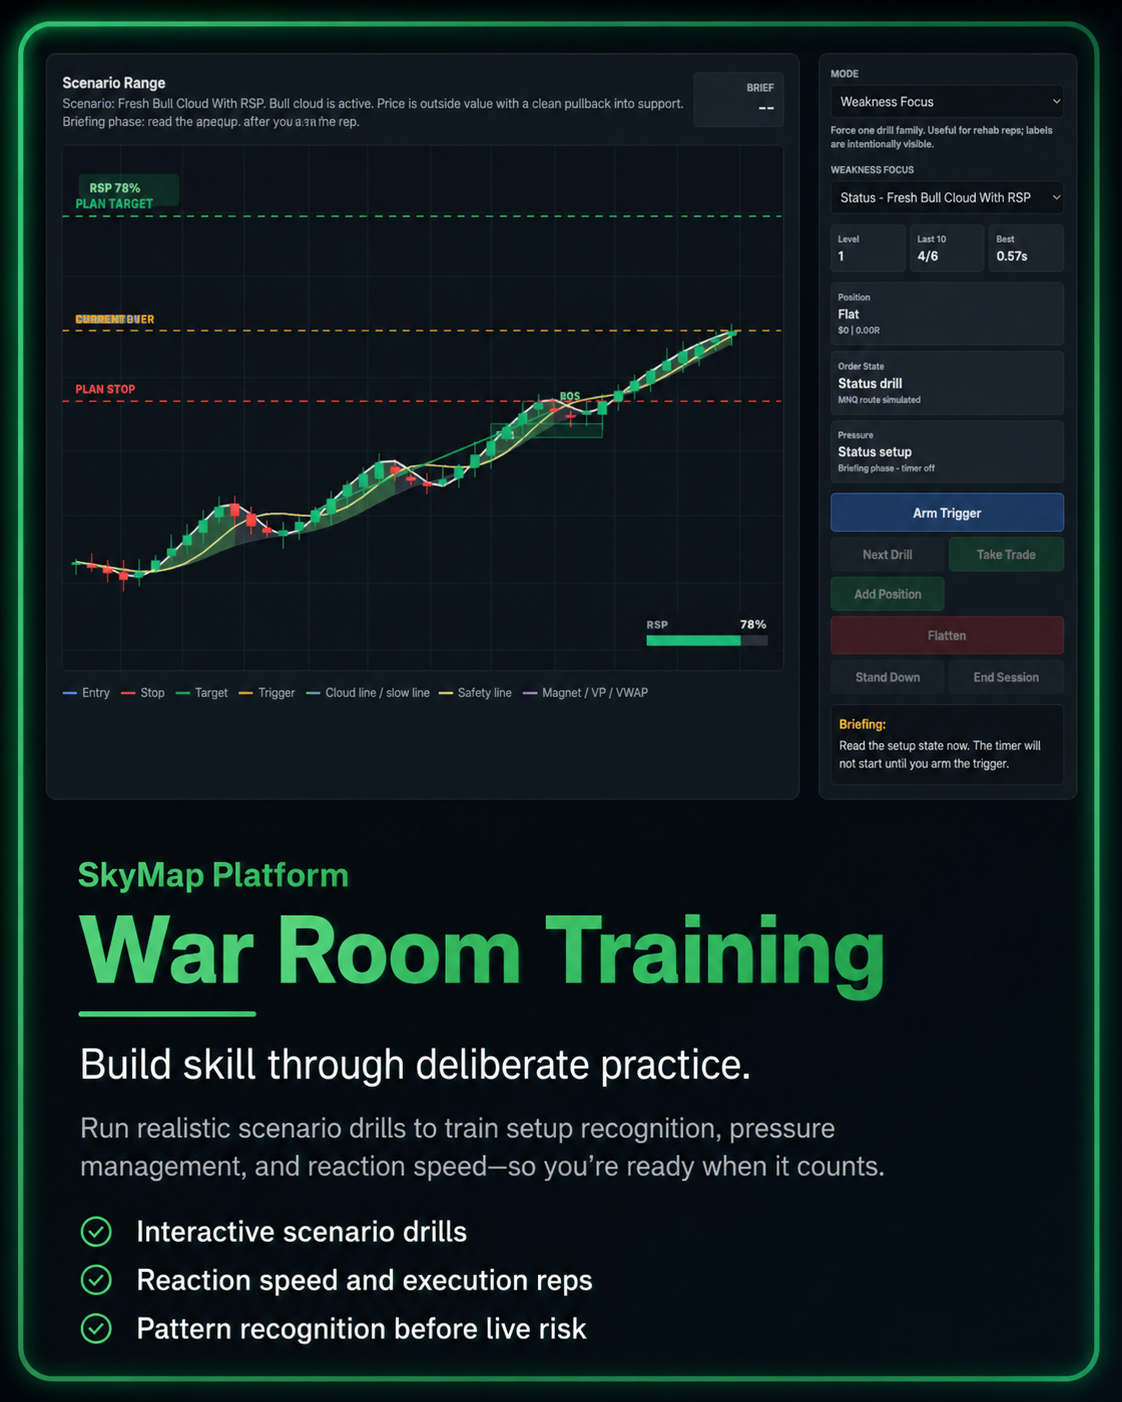 Image 5 of 5
SkyMap Mean Reversion and OrderFlow ToolKit
SkyMap Mean Reversion & Orderflow Toolkit
Read the auction beneath the candles.
Most traders see price move and immediately ask the wrong question:
“Should I buy or sell?”
The better question is:
“What is the auction doing here?”
The SkyMap Mean Reversion & Orderflow Toolkit is built to help traders read value, pressure, exhaustion, absorption, trapped participants, and rebalancing directly on the chart.
This is not a blind fade system. It is not a signal machine. It is a contextual orderflow framework designed to help you understand whether price is rejecting, accepting, trapping, exhausting, or preparing for continuation.
When price stretches away from value, not every move is ready to reverse. Sometimes the market is extended and vulnerable. Sometimes value is developing away from the mean. Sometimes aggressive traders are trapped. Sometimes the “obvious fade” is the worst trade on the board.
The toolkit is designed to help you tell the difference.
What’s Included
Mean Reversion Panel
Identify where reversion probability may exist — and where that probability may be breaking down.
The Mean Reversion Panel combines multiple contextual models into one visual decision panel, including daily anchored VWAP, ChoCH-anchored VWAP, BB + ADX zones, overlap zones, and failed-zone behavior.
Instead of fading price just because it is far from VWAP, the panel helps you evaluate whether price is actually reaching a meaningful stretch zone, rejecting an extreme, or accepting value away from the mean.
Use it to identify:
High-interest reversion zones
Daily VWAP stretch conditions
ChoCH-anchored value displacement
BB + ADX extension zones
Multi-model overlap areas
Failed fade zones
Conditions where mean reversion probability is improving or degrading
HTF Panel
Bring higher-timeframe context directly into your lower-timeframe execution chart.
The HTF Panel helps you see the bigger auction without constantly flipping timeframes. It displays higher-timeframe candle context, Stratus state, value structure, delta footprint behavior, volume profile, market structure, and higher-timeframe pressure directly inside your execution workspace.
Use it to answer:
Is the higher timeframe supporting this trade?
Is value building above or below the current area?
Are buyers or sellers trapped?
Is the lower-timeframe setup aligned with the larger auction?
Is this a real reversal attempt or just noise inside a larger move?
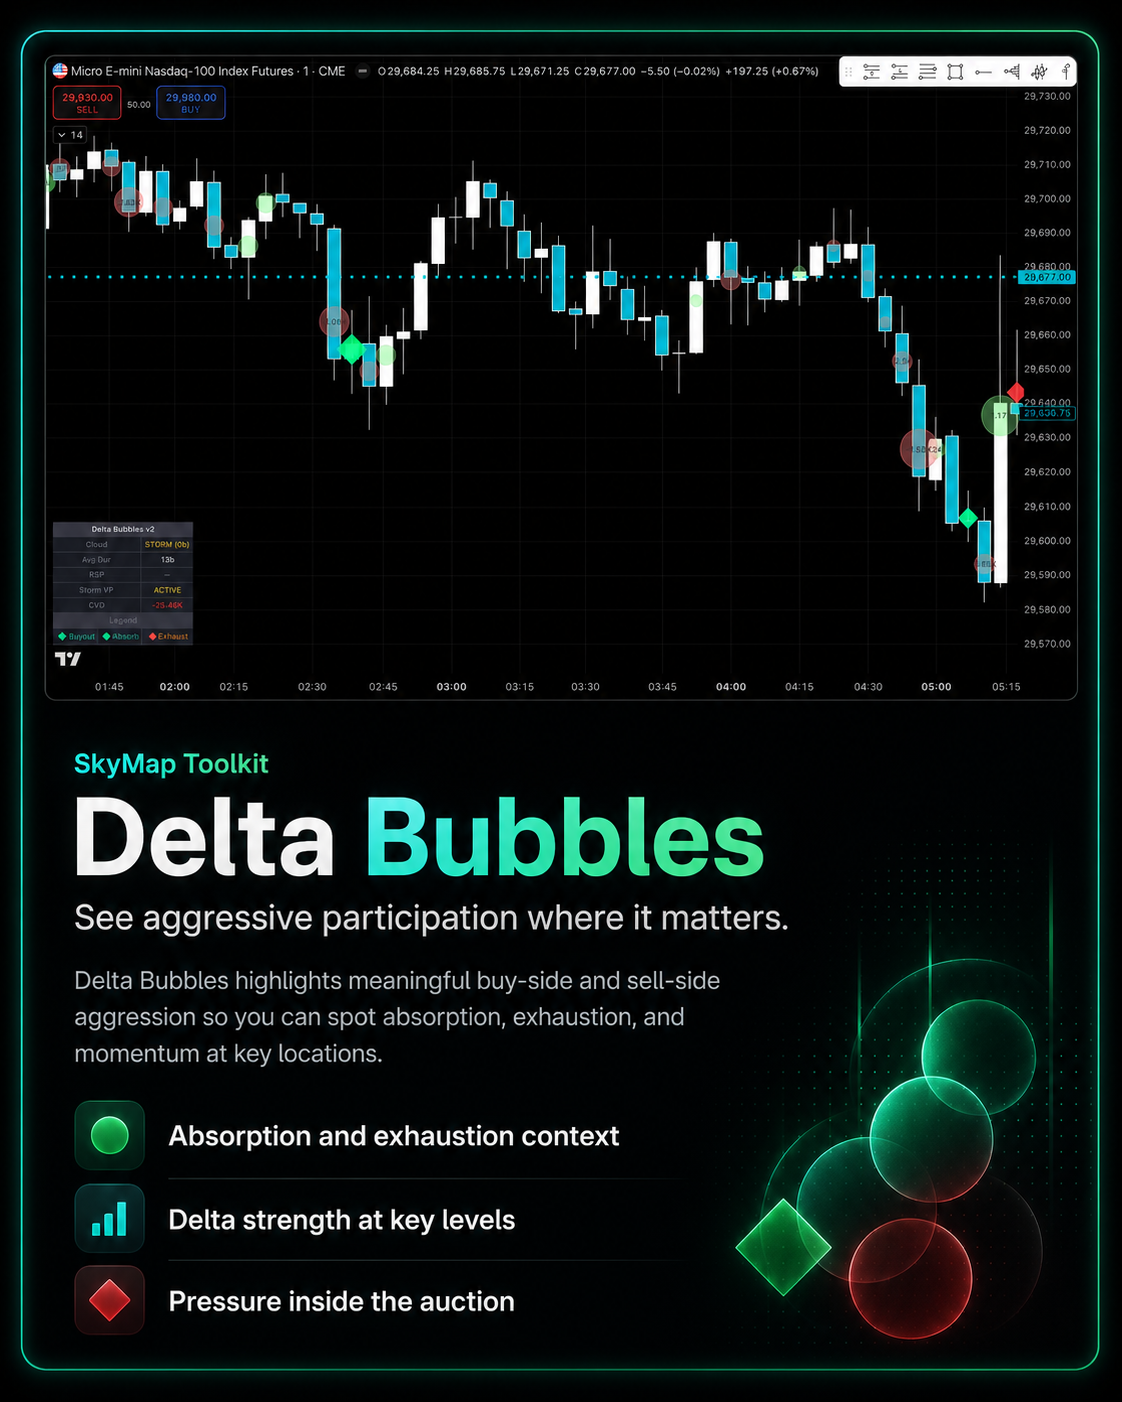
Delta Volume Bubbles
See where aggressive participation meets actual price response.
Delta Volume Bubbles highlight meaningful buy-side and sell-side aggression on the chart, helping traders identify absorption, exhaustion, breakout pressure, and impulse behavior.
Bubble size alone is not a trade. Context matters.
A large bubble at the wrong location may mean nothing. A large bubble at a magnet, VWAP band, LVN, HVN, value boundary, or failed breakout zone may reveal something much more useful.
Use Delta Bubbles to evaluate:
Absorption
Exhaustion
Breakout pressure
Ignition behavior
Aggressive buyers or sellers
Delta strength
Participation at key levels
Potential trapped traders
Storm VP
Profile the rebalancing zone before the next move begins.
Storm conditions are messy because the market is building, redistributing, or compressing value. Storm VP helps traders map that rebalancing zone by identifying where volume accumulated during the storm and where price may need to prove acceptance or rejection after resolution.
Storm VP tracks the storm area, builds the profile, finalizes key value levels, and helps traders evaluate whether price is breaking, reclaiming, holding, or rejecting the storm value area.
Use Storm VP to identify:
Storm POC
Storm VAH
Storm VAL
Value accumulation inside chop
Buyers or sellers trapped inside the storm
Acceptance outside the storm range
Failed continuation attempts
Breakout or reversal conditions after rebalancing
Built For Context, Not Blind Signals
The Mean Reversion & Orderflow Toolkit is designed to help traders stop reacting to price alone.
It helps answer deeper questions:
Is price stretched, or is value migrating?
Is this level rejecting, or accepting?
Are aggressive buyers being rewarded or trapped?
Are sellers in control, or being absorbed?
Is the market coiling, breaking, or reverting?
Does the higher timeframe support this trade?
Is there clean room back to value?
Does the trade still offer valid risk and reward?
The goal is not to predict every turn.
The goal is to stop taking low-quality trades just because price looks “too high” or “too low.”
Who This Is For
The SkyMap Mean Reversion & Orderflow Toolkit is designed for traders who:
Fade levels too early
Get trapped shorting strong trends
Buy “cheap” markets that keep accepting lower
Struggle to tell exhaustion from continuation
Want better confirmation around reversals and breakouts
Need higher-timeframe auction context on their execution chart
Want to understand participation, value, and trapped traders
Prefer structured decision-making over signal chasing
What You’ll Learn To See
With the toolkit and War Room training, you’ll learn how to evaluate:
When reversion probability is improving
When reversion probability is degrading
Where value is building
Where price is accepting or rejecting
When aggressive buying or selling is being absorbed
When effort appears late in a mature move
When a storm zone is resolving into opportunity
When trapped traders may fuel the next move
When to stand down because the stack does not agree
How It Fits Into SkyMap
The Stratus Engine System helps answer:
“Should I be trading this environment?”
The Mean Reversion & Orderflow Toolkit helps answer:
“What is the auction doing inside this environment?”
Together, they create a fuller market read: condition, value, pressure, participation, target, invalidation, and risk.
Included Tools
Mean Reversion Panel
HTF Panel
Delta Volume Bubbles
Storm VP
War Room training modules
Scenario-based practice drills
Framework updates
One-Time Purchase. Lifetime Access.
No monthly subscription.
No recurring billing.
Buy the toolkit once and get permanent access to the indicators, training material, and future updates included with this package.
Important Note
Strategic Edge tools are educational and performance-training tools. They do not provide financial advice, investment advice, or live trade recommendations. Every trader is responsible for their own trades, risk, and platform use.
SkyMap Mean Reversion & Orderflow Toolkit
Read the auction beneath the candles.
Most traders see price move and immediately ask the wrong question:
“Should I buy or sell?”
The better question is:
“What is the auction doing here?”
The SkyMap Mean Reversion & Orderflow Toolkit is built to help traders read value, pressure, exhaustion, absorption, trapped participants, and rebalancing directly on the chart.
This is not a blind fade system. It is not a signal machine. It is a contextual orderflow framework designed to help you understand whether price is rejecting, accepting, trapping, exhausting, or preparing for continuation.
When price stretches away from value, not every move is ready to reverse. Sometimes the market is extended and vulnerable. Sometimes value is developing away from the mean. Sometimes aggressive traders are trapped. Sometimes the “obvious fade” is the worst trade on the board.
The toolkit is designed to help you tell the difference.
What’s Included
Mean Reversion Panel
Identify where reversion probability may exist — and where that probability may be breaking down.
The Mean Reversion Panel combines multiple contextual models into one visual decision panel, including daily anchored VWAP, ChoCH-anchored VWAP, BB + ADX zones, overlap zones, and failed-zone behavior.
Instead of fading price just because it is far from VWAP, the panel helps you evaluate whether price is actually reaching a meaningful stretch zone, rejecting an extreme, or accepting value away from the mean.
Use it to identify:
High-interest reversion zones
Daily VWAP stretch conditions
ChoCH-anchored value displacement
BB + ADX extension zones
Multi-model overlap areas
Failed fade zones
Conditions where mean reversion probability is improving or degrading
HTF Panel
Bring higher-timeframe context directly into your lower-timeframe execution chart.
The HTF Panel helps you see the bigger auction without constantly flipping timeframes. It displays higher-timeframe candle context, Stratus state, value structure, delta footprint behavior, volume profile, market structure, and higher-timeframe pressure directly inside your execution workspace.
Use it to answer:
Is the higher timeframe supporting this trade?
Is value building above or below the current area?
Are buyers or sellers trapped?
Is the lower-timeframe setup aligned with the larger auction?
Is this a real reversal attempt or just noise inside a larger move?
Delta Volume Bubbles
See where aggressive participation meets actual price response.
Delta Volume Bubbles highlight meaningful buy-side and sell-side aggression on the chart, helping traders identify absorption, exhaustion, breakout pressure, and impulse behavior.
Bubble size alone is not a trade. Context matters.
A large bubble at the wrong location may mean nothing. A large bubble at a magnet, VWAP band, LVN, HVN, value boundary, or failed breakout zone may reveal something much more useful.
Use Delta Bubbles to evaluate:
Absorption
Exhaustion
Breakout pressure
Ignition behavior
Aggressive buyers or sellers
Delta strength
Participation at key levels
Potential trapped traders
Storm VP
Profile the rebalancing zone before the next move begins.
Storm conditions are messy because the market is building, redistributing, or compressing value. Storm VP helps traders map that rebalancing zone by identifying where volume accumulated during the storm and where price may need to prove acceptance or rejection after resolution.
Storm VP tracks the storm area, builds the profile, finalizes key value levels, and helps traders evaluate whether price is breaking, reclaiming, holding, or rejecting the storm value area.
Use Storm VP to identify:
Storm POC
Storm VAH
Storm VAL
Value accumulation inside chop
Buyers or sellers trapped inside the storm
Acceptance outside the storm range
Failed continuation attempts
Breakout or reversal conditions after rebalancing
Built For Context, Not Blind Signals
The Mean Reversion & Orderflow Toolkit is designed to help traders stop reacting to price alone.
It helps answer deeper questions:
Is price stretched, or is value migrating?
Is this level rejecting, or accepting?
Are aggressive buyers being rewarded or trapped?
Are sellers in control, or being absorbed?
Is the market coiling, breaking, or reverting?
Does the higher timeframe support this trade?
Is there clean room back to value?
Does the trade still offer valid risk and reward?
The goal is not to predict every turn.
The goal is to stop taking low-quality trades just because price looks “too high” or “too low.”
Who This Is For
The SkyMap Mean Reversion & Orderflow Toolkit is designed for traders who:
Fade levels too early
Get trapped shorting strong trends
Buy “cheap” markets that keep accepting lower
Struggle to tell exhaustion from continuation
Want better confirmation around reversals and breakouts
Need higher-timeframe auction context on their execution chart
Want to understand participation, value, and trapped traders
Prefer structured decision-making over signal chasing
What You’ll Learn To See
With the toolkit and War Room training, you’ll learn how to evaluate:
When reversion probability is improving
When reversion probability is degrading
Where value is building
Where price is accepting or rejecting
When aggressive buying or selling is being absorbed
When effort appears late in a mature move
When a storm zone is resolving into opportunity
When trapped traders may fuel the next move
When to stand down because the stack does not agree
How It Fits Into SkyMap
The Stratus Engine System helps answer:
“Should I be trading this environment?”
The Mean Reversion & Orderflow Toolkit helps answer:
“What is the auction doing inside this environment?”
Together, they create a fuller market read: condition, value, pressure, participation, target, invalidation, and risk.
Included Tools
Mean Reversion Panel
HTF Panel
Delta Volume Bubbles
Storm VP
War Room training modules
Scenario-based practice drills
Framework updates
One-Time Purchase. Lifetime Access.
No monthly subscription.
No recurring billing.
Buy the toolkit once and get permanent access to the indicators, training material, and future updates included with this package.
Important Note
Strategic Edge tools are educational and performance-training tools. They do not provide financial advice, investment advice, or live trade recommendations. Every trader is responsible for their own trades, risk, and platform use.